
US Tariffs: 2025 Analysis
Understanding the latest tariff policies, economic impacts, and historical context
Introduction to US Tariffs
The United States has entered a new era of trade policy with the implementation of sweeping tariffs across global imports. As of April 10th, 2025, the Trump administration has established a baseline tariff of 10% on nearly all imports, with significantly higher rates for specific countries. These tariffs represent one of the most aggressive trade policy shifts in modern American history, with far-reaching implications for the US economy, global trade relationships, and international markets. To calculate your import tariffs use our free US Tariff Calculator
Key Points:
- Standard global baseline tariff rate of 10% implemented on all imported goods
- Targeted higher rates for specific countries, with China facing the highest at 145%
- Economic projections suggest significant impacts on GDP, employment, and inflation
- Global retaliatory measures already being implemented by major trading partners
This comprehensive analysis examines the latest tariff policies, their projected economic impacts, historical context of US tariff implementation, and industry-specific effects. By understanding both the historical patterns and current policy direction, businesses and consumers can better navigate the changing landscape of international trade.
Latest US Tariff Rates (April 2025)
The current US tariff structure reflects a significant shift in trade policy, with rates varying substantially by country. As of noon Central Daylight Time (CDT) on April 10th, 2025, the standard baseline tariff rate of 10% is in effect for most countries, with notable exceptions for several major trading partners:
China
145%
Highest rate among all trading partners
Canada
25%
Key USMCA trading partner
Mexico
25%
Key USMCA trading partner
European Union
20%
Collective rate for EU member states
The complete tariff schedule covers a wide range of countries, with rates determined largely through what the administration has termed "reciprocal" tariffs designed to match perceived trade imbalances.
| Country | Reciprocal Tariff (Adjusted) |
|---|---|
| Global Baseline | 10% |
| China | 145% |
| Canada | 25% |
| Mexico | 25% |
| European Union | 20% |
| South Korea | 25% |
| Japan | 24% |
| India | 26% |
| Vietnam | 46% |
| Cambodia | 49% |
| Bangladesh | 37% |
| Indonesia | 32% |
| Thailand | 36% |
| Malaysia | 24% |
| Taiwan | 32% |
| Israel | 17% |
| Switzerland | 31% |
| Norway | 15% |
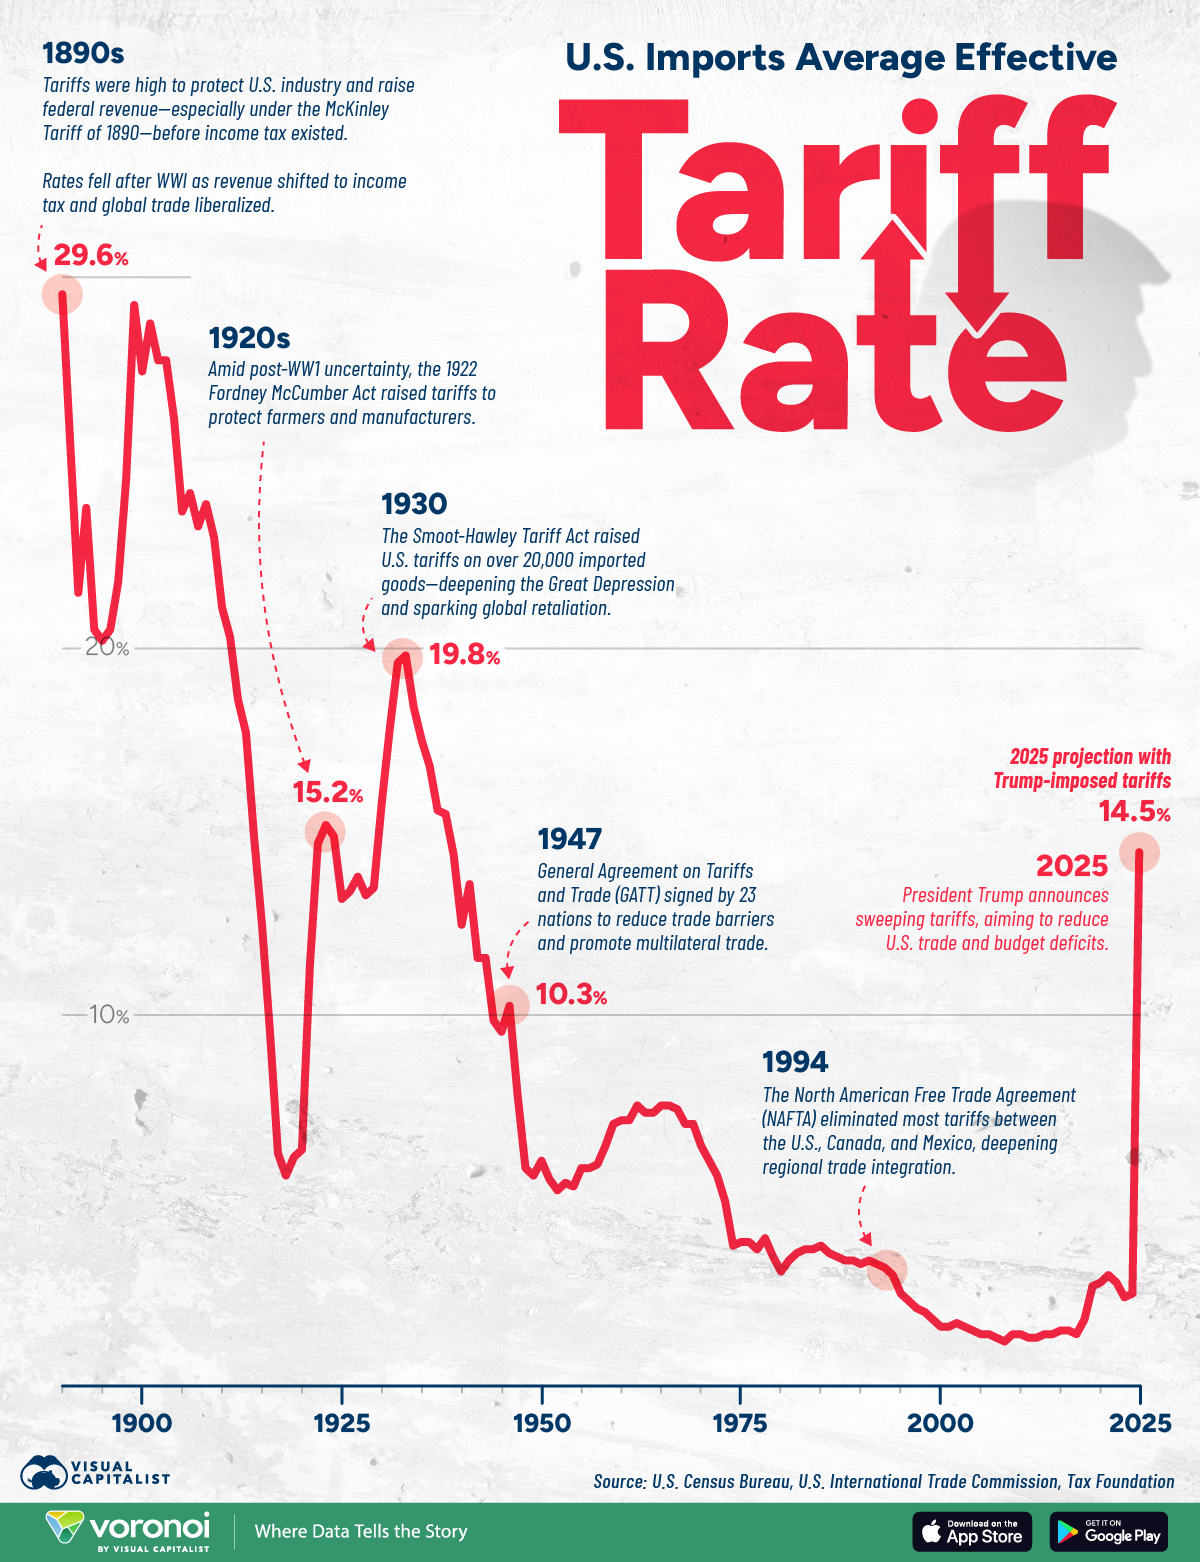
Historical US tariff rates showing the dramatic increase in 2025 compared to the past century
The current average effective tariff rate of 27% represents the highest level in the United States since 1903. This marks a significant departure from the generally low tariff environment that has characterized US trade policy since the end of World War II.
Economic Impact of Tariffs
The implementation of wide-reaching tariffs has significant implications for the US economy, global trade relationships, and financial markets. Economic analyses from multiple institutions project substantial impacts across various economic indicators:
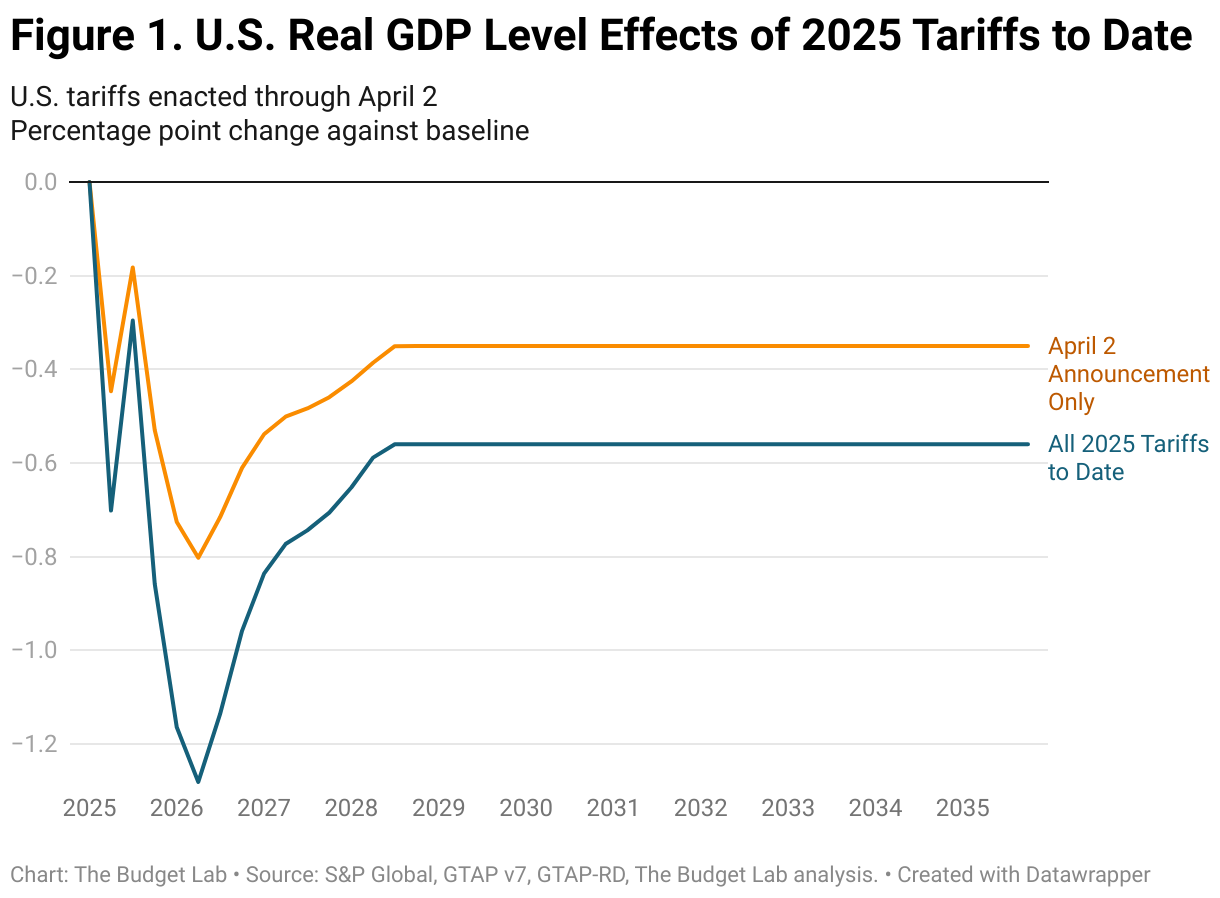
GDP Impact
According to analysis from Yale University's Budget Lab, all US tariffs enacted in 2025 through April are projected to reduce real GDP growth by 1.1 percentage points over calendar year 2025 (measured Q4-to-Q4). The International Monetary Fund (IMF) similarly projects that the combination of US tariffs and retaliatory measures could reduce US GDP by approximately 1% and global GDP by a similar magnitude.
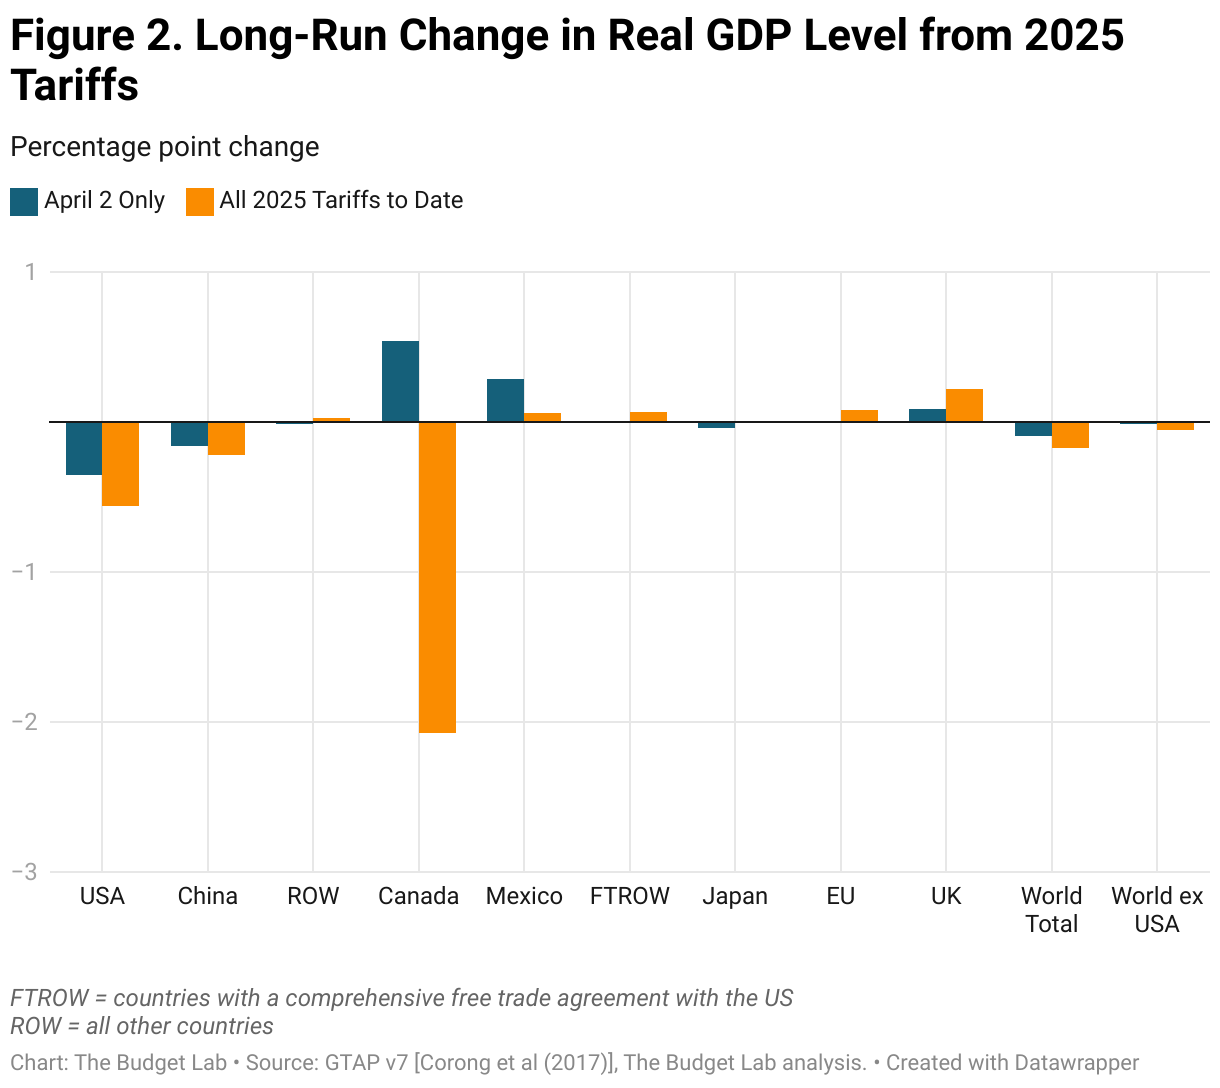
Projected impact of tariffs on US real GDP growth (Source: Yale Budget Lab)
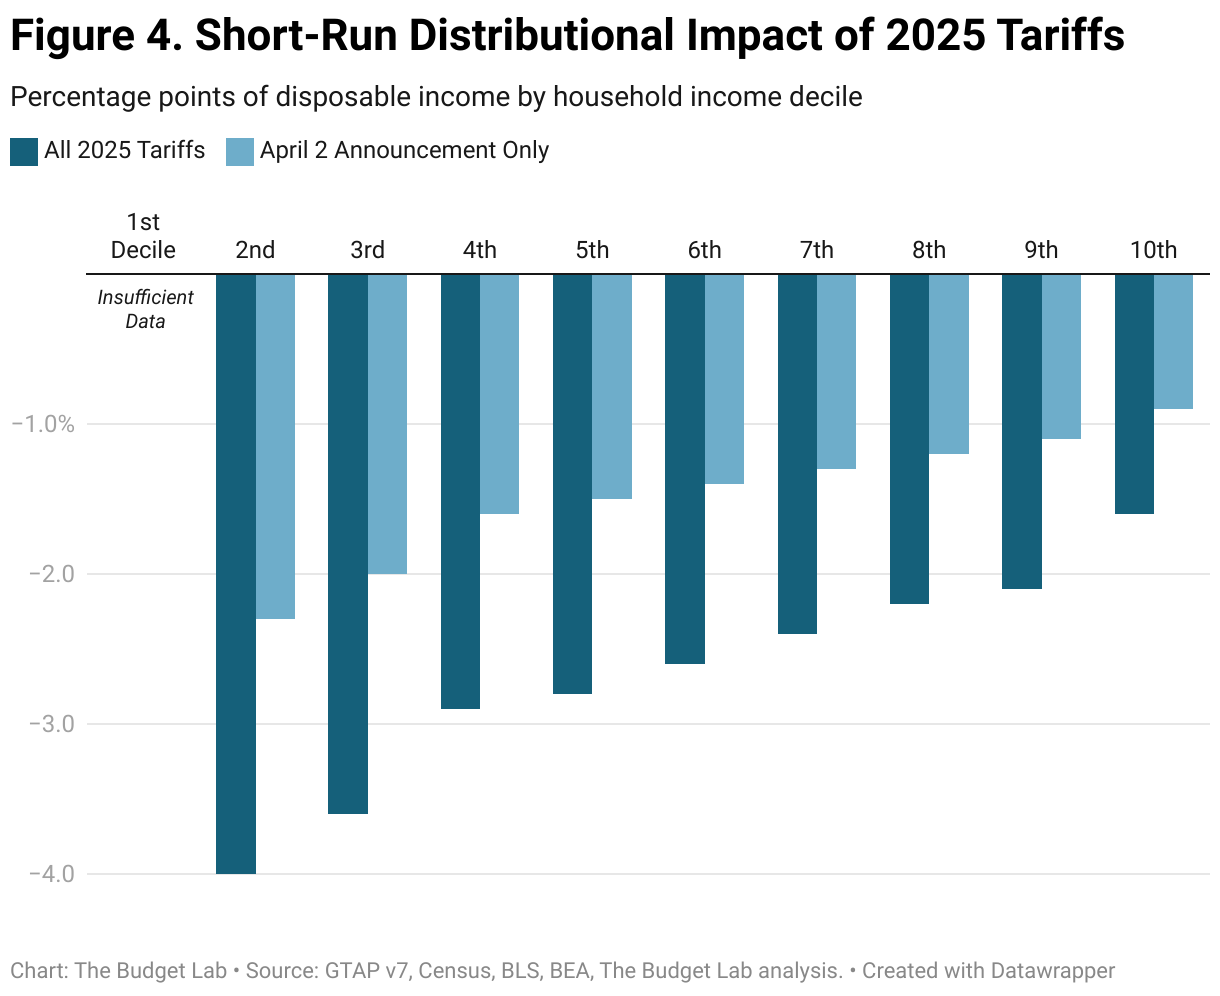
Inflation and Consumer Prices
Tariffs function as a tax on imports, with much of the cost ultimately passed through to consumers. Economic projections indicate that the current tariff structure will raise the overall price level by approximately 2.3% in the short run, equivalent to an average household consumer loss of $3,800 annually.
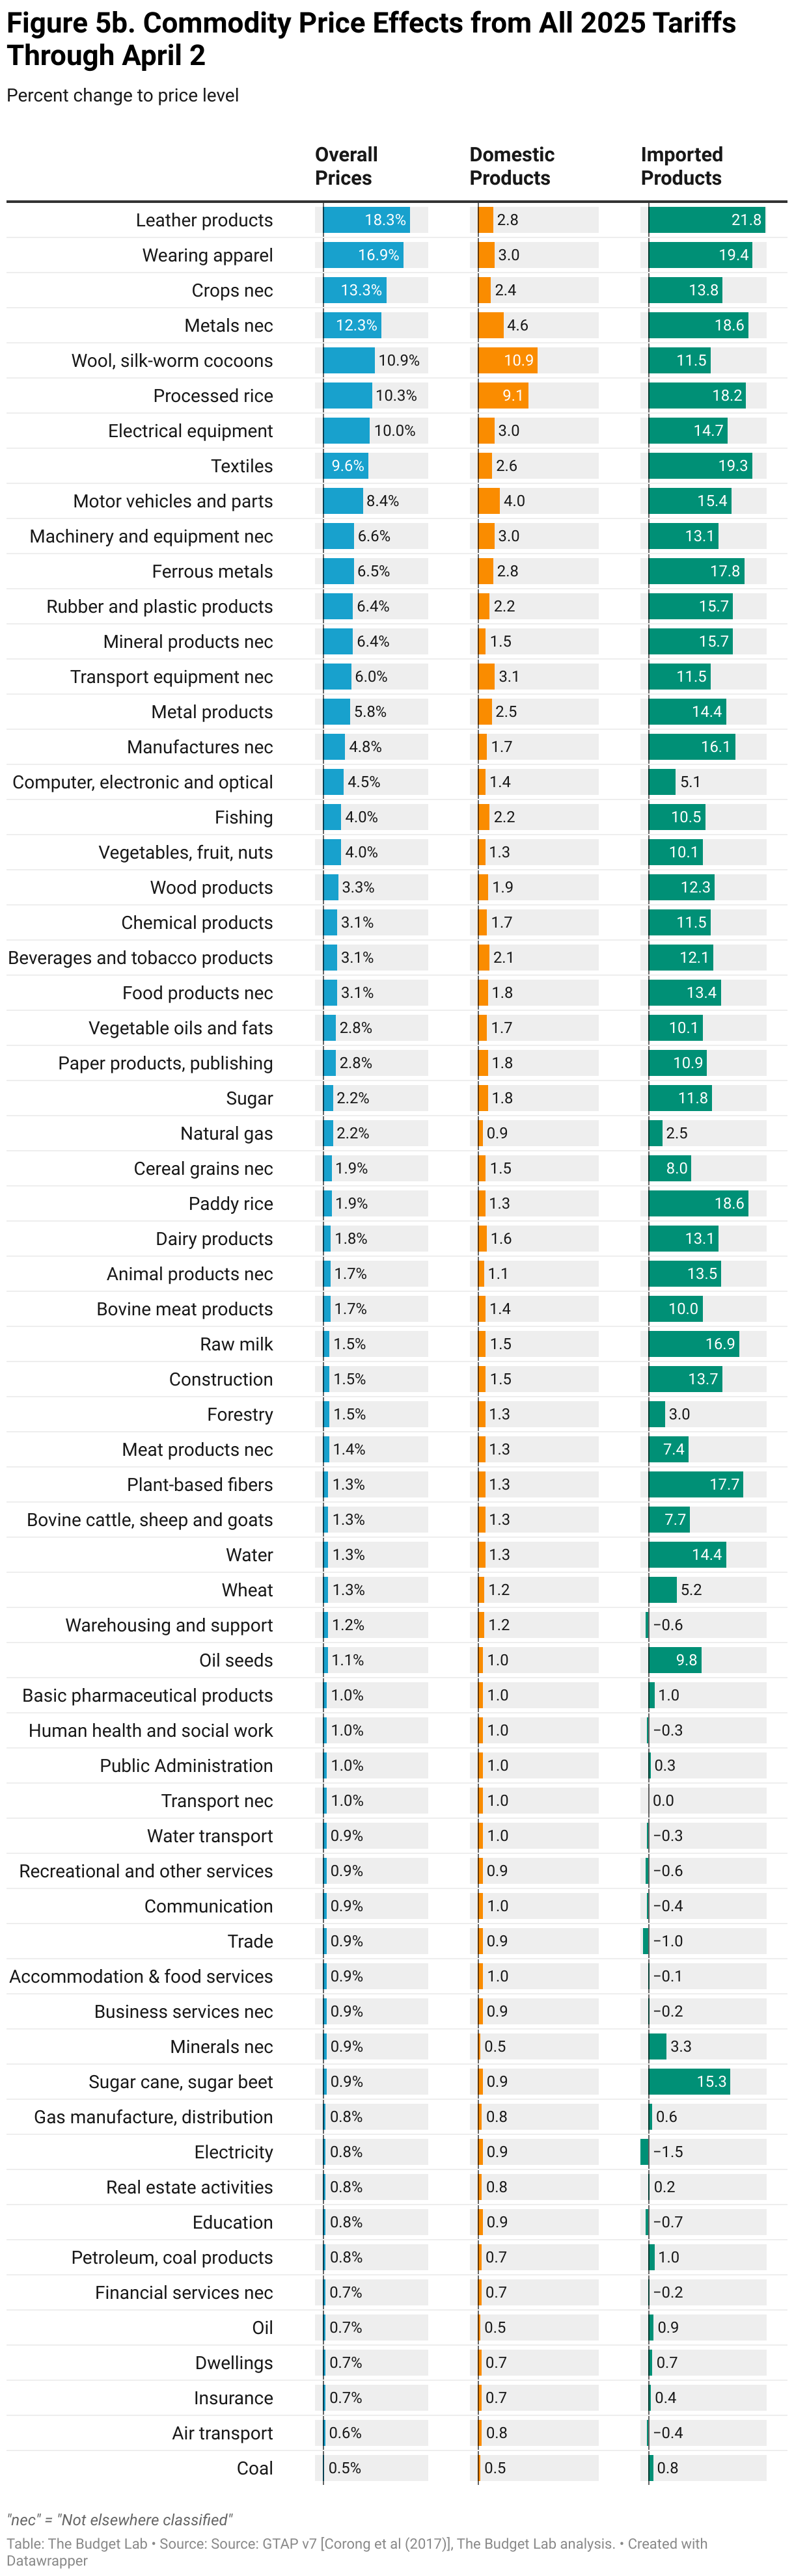
Projected impact of tariffs on consumer prices by category (Source: Yale Budget Lab)
Certain consumer goods are projected to see particularly steep price increases:
- Apparel and footwear: 15-30% price increases
- Consumer electronics: 10-25% price increases
- Automobiles and parts: 10-15% price increases
- Household goods and furniture: 8-18% price increases
Employment and Labor Market
The tariffs are projected to have significant effects on employment. The unemployment rate is expected to rise by 0.6 percentage points by the end of 2025, with payroll employment approximately 740,000 lower than would otherwise be expected.
Key Employment Statistics:
- Projected job losses concentrated in manufacturing (320,000), retail (180,000), and transportation / logistics (110,000)
- Some offsetting job gains in domestic production sectors that benefit from protection (estimated at 120,000-150,000)
- Net negative effect on overall employment and wages
Stock Market Impact
Financial markets have experienced significant volatility in response to tariff announcements and implementation. The S&P 500 index slumped 3.5% on April 11, 2025, following clarification that tariffs on Chinese imports would total 145%. This followed a period of substantial market turbulence as various tariff measures were announced and implemented.
The market impact has varied significantly by sector:
- Consumer discretionary stocks have been among the hardest hit, with many retailers seeing 8-15% declines
- Technology companies with significant exposure to China have experienced 5-12% declines
- Some domestic steel and aluminum producers have seen stock price gains of 3-8%
- Agricultural companies have faced pressure due to retaliatory tariffs on US exports
Government Revenue
The tariffs will generate significant government revenue, estimated at $2.4 trillion over 2026-2035, though this figure includes a negative dynamic revenue effect of $587 billion due to slowed economic growth. The net fiscal impact is projected to be less than the headline revenue figures suggest due to these offsetting factors.
Summary of economic impacts across key indicators (Source: Yale Budget Lab)
History of Tariffs in the United States
Tariffs have played a significant role in US economic policy since the founding of the nation. Understanding this historical context provides valuable perspective on current tariff policies.
Early American Tariffs (1789-1860)
The first major American tariff legislation was the Tariff Act of 1789, signed by President George Washington on July 4th. This act had two primary purposes: to raise revenue for the federal government and to protect domestic manufacturing. During this early period of American history, tariffs served as the primary source of federal revenue, accounting for 50-90% of government income.
Key tariff legislation during this period included:
- Tariff of 1816: The first explicitly protectionist tariff, designed to shield new American industries from European competition following the War of 1812
- Tariff of 1828: Known as the "Tariff of Abominations," this highly protective measure imposed duties averaging 50% and sparked significant sectional tensions between North and South
- Compromise Tariff of 1833: Gradually reduced tariff rates to resolve the Nullification Crisis

Historical US tariff rates from 1821 to 2016, showing the dramatic fluctuations over time (Source: Wikipedia)
The Restriction Period (1861-1933)
From the Civil War through the Great Depression, US trade policy was characterized by high tariffs intended to protect domestic industry. During this "restriction period," as economist Douglas Irwin termed it, average tariff rates increased to approximately 50% and remained at that level for several decades.
Key developments included:
- Morrill Tariff of 1861: Raised industrial tariffs to an average of 20% to finance the Civil War
- McKinley Tariff of 1890: Raised average tariff rates to 49.5%, the highest in US history to that point
- Fordney-McCumber Tariff of 1922: Raised tariffs to protect industries that had developed during World War I
- Smoot-Hawley Tariff Act of 1930: Raised duties on over 20,000 imported goods to record levels, contributing to a collapse in international trade during the Great Depression
Trade Liberalization Era (1934-2017)
Following the economic catastrophe of the Great Depression, US trade policy underwent a dramatic shift toward liberalization. The Reciprocal Trade Agreements Act of 1934 marked the beginning of this new approach, empowering the president to negotiate bilateral agreements to reduce tariffs.
Key developments in this period included:
- GATT Formation (1947): The US played a leading role in establishing the General Agreement on Tariffs and Trade, which substantially reduced global tariff barriers
- Kennedy Round (1964-1967): Achieved tariff reductions averaging 35% on thousands of products
- Tokyo Round (1973-1979): Further reduced tariffs and addressed non-tariff barriers
- Uruguay Round (1986-1994): Led to the creation of the World Trade Organization (WTO) and substantial tariff reductions
- NAFTA (1994): Eliminated most tariffs among the United States, Canada, and Mexico
By the early 21st century, US tariffs had reached historic lows, with the average tariff rate on imported goods falling to approximately 1.6% by 2016.
Recent Shift (2018-Present)
Beginning in 2018, US trade policy began shifting back toward protectionism. The first Trump administration implemented significant tariffs on washing machines, solar panels, steel, aluminum, and a wide range of Chinese goods. After a brief period of stabilization during the Biden administration, the second Trump administration has implemented the most sweeping tariff increases since the early 20th century.
Key Recent Developments:
- February 2025: 25% tariffs implemented on steel and aluminum from all countries
- April 2, 2025: Declaration of "national emergency" to address trade deficits, implementation of baseline 10% tariff on all imports
- April 5, 2025: Additional country-specific tariffs implemented, with 57 countries facing rates above the 10% baseline
- April 10, 2025: Escalation of China tariffs to 145% total
1789
First Tariff Act
The Tariff Act of 1789 established a 5% duty on most imports, serving as both protection for domestic industry and revenue generation.
1828
Tariff of Abominations
High protective tariffs averaging 50% sparked sectional conflict between industrial North and agricultural South.
1930
Smoot-Hawley Tariff
Dramatic tariff increases during the Great Depression triggered international retaliation and deepened the economic crisis.
1947
GATT Formation
US leads formation of GATT, beginning decades of multilateral tariff reductions and trade liberalization.
1994
NAFTA Implementation
North American Free Trade Agreement eliminates most tariffs between US, Canada, and Mexico.
2018
Steel & Aluminum Tariffs
Trump administration implements 25% tariff on steel and 10% on aluminum, signaling shift toward protectionism.
2025
Universal Tariff Implementation
Baseline 10% tariff implemented on all imports with significant country-specific increases, marking highest effective tariff rate since 1903.
Successful and Failed Tariff Implementations
Throughout US history, tariffs have met with varying degrees of success and failure. Examining past experiences provides valuable context for understanding potential outcomes of current policy.
Successful Tariff Cases
Tariff of 1816
The "protective tariff" successfully sheltered emerging American industries following the War of 1812, allowing domestic manufacturing to develop without overwhelming foreign competition. It particularly benefited the textile industry in New England and iron manufacturing in Pennsylvania.
Semiconductor Tariffs (1980s)
Targeted tariffs on Japanese semiconductors in the 1980s, combined with investment in domestic research and development, helped US semiconductor manufacturers regain competitiveness in global markets.
Steel Tariffs (2002-2003)
While controversial, the temporary steel tariffs implemented by the Bush administration provided breathing room for the US steel industry to restructure and invest in more efficient production methods, though at a cost to steel-consuming industries.
Common Elements of Successful Tariff Implementation:
- Targeted protection of specific industries rather than broad application
- Clear time limitations to prevent industry complacency
- Coordination with complementary policies (investment, research support, worker training)
- Implementation during periods of economic expansion rather than contraction
- Limited international retaliation due to strategic implementation or negotiation
Failed Tariff Cases
Smoot-Hawley Tariff (1930)
Perhaps the most infamous failure in US tariff history, the Smoot-Hawley Tariff raised rates to historic highs during the Great Depression. The result was devastating: retaliatory tariffs from trading partners, a 66% decline in global trade, and a deepening of the economic crisis.
Tariff of Abominations (1828)
This highly protective tariff favored Northern manufacturing interests while harming Southern agricultural exporters. The resulting sectional tension contributed to the Nullification Crisis and increased the division between North and South in the years leading to the Civil War.
Motorcycle Tariffs (1983)
While these tariffs temporarily protected Harley-Davidson, they ultimately drove up prices for American consumers and failed to address the fundamental competitiveness issues in the US motorcycle industry.
Common Elements of Failed Tariff Implementation:
- Broad application across multiple industries or trading partners
- Implementation during economic downturns
- Provoking substantial retaliatory measures from trading partners
- Failure to address underlying competitiveness issues
- High costs to downstream industries and consumers
- Protection of inefficient industries without accompanying modernization incentives
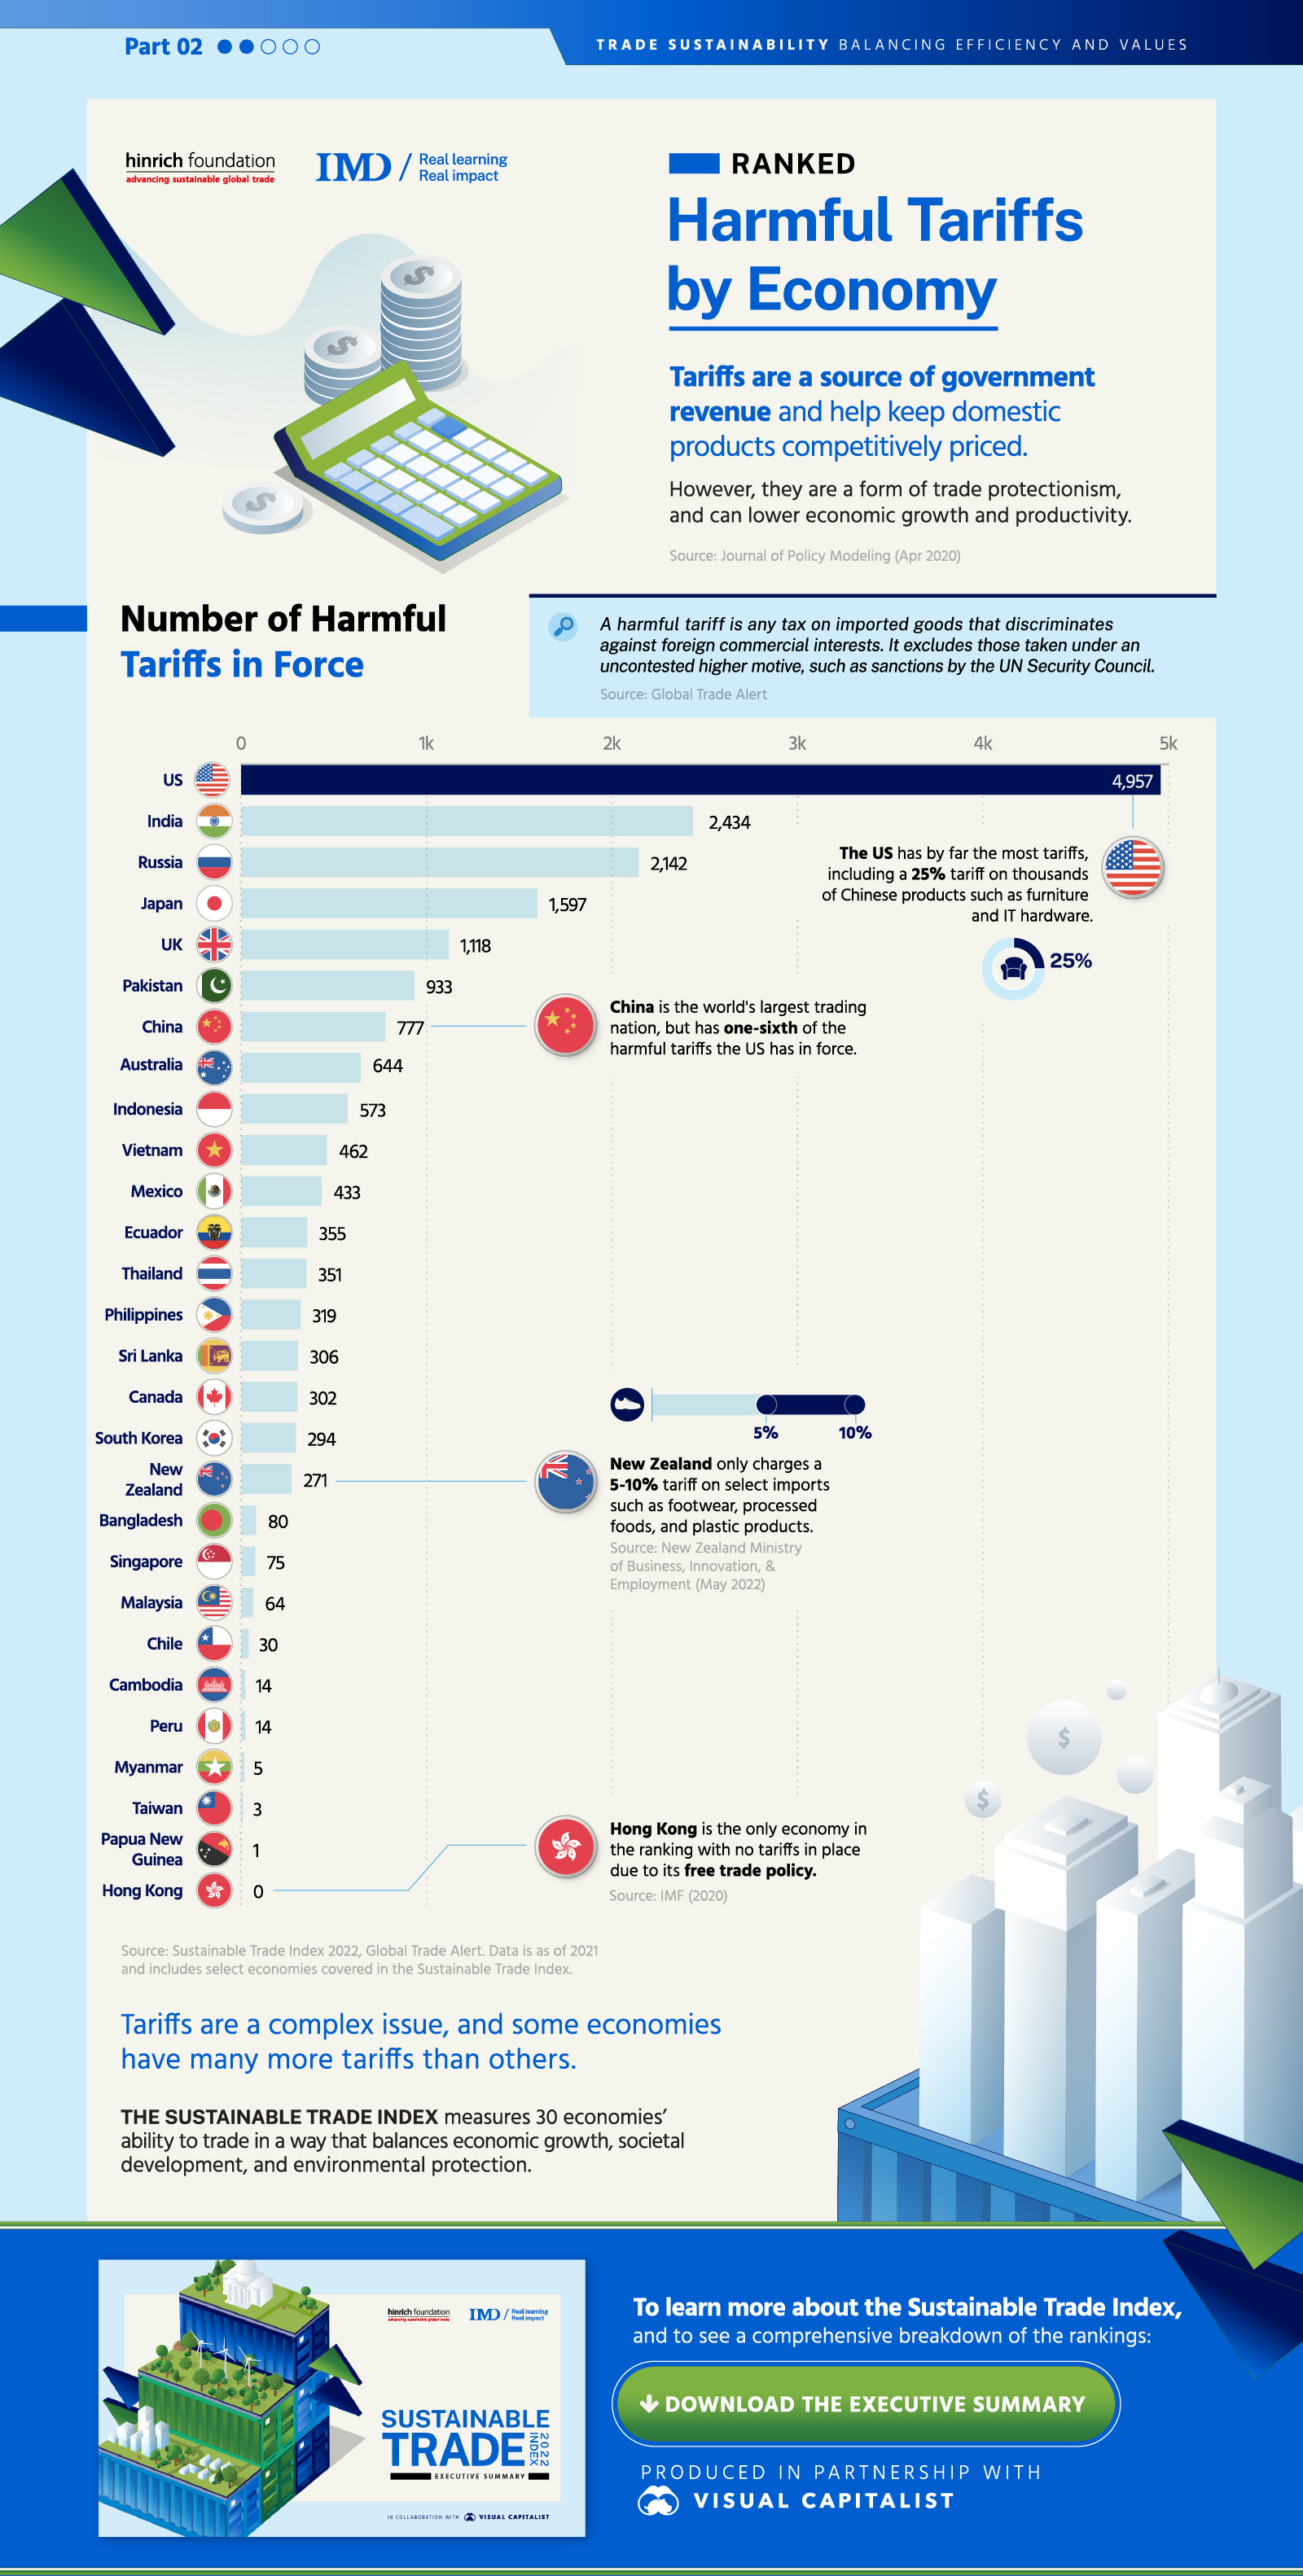
Analysis of harmful tariff impacts across global economies (Source: Visual Capitalist)
Industry-Specific Effects of Current Tariffs
The 2025 tariff policies will have substantially different effects across various sectors of the US economy. Some industries stand to benefit from increased protection, while others face significant challenges from higher input costs, retaliatory tariffs, and supply chain disruptions.
Automotive Industry
The automotive sector faces particularly severe impacts from the 2025 tariff structure. A study by the Center for Automotive Research estimates that the 25% tariff on automotive imports could cost US automakers $108 billion annually. Even domestically manufactured vehicles rely heavily on imported components, with the average American-made car containing 40-60% imported parts.
Key Impacts:
- Price increases of 10-15% on vehicles affected by full 25% tariffs
- Price increases of 5% on vehicles less directly affected
- Estimated reduction in annual US auto sales of 1.3-2.2 million units
- Potential job losses of 40,000-120,000 across the automotive value chain
- Significant disruption to integrated North American auto supply chains
Several automakers have already announced price increases, while others are adjusting production strategies to mitigate tariff impacts. Some manufacturers are exploring increased domestic sourcing, though industry experts note significant constraints on the ability to rapidly reshape complex global supply chains.
Consumer Electronics
Consumer electronics face substantial tariff exposure, particularly due to the high concentration of manufacturing in China and Southeast Asia. The 145% tariff on Chinese imports will dramatically impact products ranging from smartphones and laptops to household appliances and gaming consoles.
Industry analysis projects:
- Smartphone price increases of 15-30% depending on manufacturing origin
- Laptop and tablet price increases of 12-25%
- Smart home device price increases of 15-35%
- Reduced consumer purchasing power leading to 15-25% volume decreases
Many electronics manufacturers are accelerating plans to diversify production away from China, though such transitions typically require 2-3 years for completion. In the interim, consumers will face significantly higher prices for these products.
Apparel and Footwear
The apparel and footwear industry relies heavily on imports, with approximately 97% of clothing and 98% of footwear sold in the US manufactured overseas. Major production hubs face substantially increased tariffs: Vietnam (46%), Bangladesh (37%), Cambodia (49%), and China (145%).
Price effects by consumer category, showing significant impacts on apparel (Source: Yale Budget Lab)
The American Apparel & Footwear Association projects:
- Price increases of 15-30% for most clothing items
- Price increases of 20-40% for footwear
- Reduced consumer purchasing leading to unit sales declines of 10-20%
- Retail job losses of 30,000-50,000 due to reduced sales volume
Steel and Aluminum
Domestic steel and aluminum producers are among the few industries that stand to benefit from the current tariff structure. The combination of existing 25% tariffs on steel imports and the new overlapping tariffs creates substantial protection for domestic producers.
Projected Benefits:
- Domestic steel price increases of 15-25%
- Increased capacity utilization at US mills
- Potential for 5,000-15,000 new jobs in primary metal production
However, these benefits come at a substantial cost to steel-consuming industries, which employ approximately 40 times more workers than steel production. For every job created in steel production, economists estimate 6-8 jobs lost in steel-using industries due to higher input costs.
Agriculture
The agricultural sector faces unique challenges from the current tariff environment. While tariffs on imported agricultural products provide some protection for domestic producers, the more significant impact comes from retaliatory tariffs imposed by trading partners on US agricultural exports.
China's increase of retaliatory tariffs to 125% presents particular challenges for:
- Soybean exports (China previously purchased ~60% of US exports)
- Pork producers (China was the third-largest export market)
- Tree nut growers (almonds, walnuts, pistachios)
- Fruit exporters
The USDA estimates that retaliatory tariffs could reduce US agricultural exports by $12-18 billion annually, with particularly severe impacts on midwestern grain producers and California specialty crop growers.
Global Responses to US Tariffs
The international community has responded to US tariff policies with a combination of retaliatory measures, diplomatic initiatives, and economic adjustments. These responses shape the ultimate impact of US tariff policy and influence both domestic and global economic outcomes.
Retaliatory Tariffs
Major trading partners have implemented or announced significant retaliatory tariffs in response to US measures:
| Country/Region | Retaliatory Measure | Targeted US Sectors |
|---|---|---|
| China | 125% tariff on all US goods (increased from 84%) | Agriculture, aircraft, automobiles, chemicals |
| European Union | 90-day delay of planned 20% tariffs for negotiations | Agricultural products, vehicles, Kentucky bourbon, textiles |
| Canada | 25% tariffs on $15 billion of US goods | Steel, aluminum, agricultural products, consumer goods |
| Mexico | 25% tariffs on $12 billion of US goods | Agricultural products, steel, automotive parts |
| Japan | Announced plans for "equivalent measures" | Under development |
Trade Diversion Effects
The steep tariffs on certain countries are creating significant trade diversion effects, as importers seek alternative sourcing to avoid the highest tariffs. This is particularly evident with Chinese goods facing 145% tariffs, where production is shifting to:
- Vietnam and Cambodia (despite their own substantial tariffs of 46% and 49%)
- Mexico (25% tariff represents significant advantage over China's 145%)
- India (26% tariff)
- Bangladesh (37% tariff)
However, economists note that these shifts face significant constraints in the short term due to capacity limitations, infrastructure requirements, and the complex nature of established supply chains.
Dollar Impact
The US dollar has experienced significant volatility in response to tariff developments. Following the announcement of China's increase to 125% retaliatory tariffs, the dollar fell 1.8% against a basket of major currencies, reflecting concerns about US economic growth and potential inflation.
Currency analysts project:
- Short-term dollar strength as tariffs initially increase demand for dollars to pay for more expensive imports
- Medium-term dollar weakness as trade volumes decline and economic growth slows
- Increased currency volatility as markets adjust to the new trade environment
WTO Challenges
Multiple countries have filed or announced intentions to file World Trade Organization (WTO) challenges to US tariff measures. China's Commerce Ministry has filed another lawsuit with the WTO against US tariffs, arguing they violate foundational WTO principles.
The WTO dispute resolution process faces significant challenges, however:
- The US invoked national security exemptions under IEEPA for the tariffs, which complicates WTO adjudication
- The WTO Appellate Body remains non-functional due to US blocking of judge appointments
- The dispute resolution process typically requires 2-3 years for resolution
These practical limitations reduce the likelihood of effective WTO constraints on current US tariff policies in the near term.
Conclusion and Future Outlook
The United States has embarked on its most significant shift in trade policy in nearly a century, with tariff rates reaching levels not seen since the early 1900s. This dramatic change carries profound implications for the US economy, global trade relationships, and the international economic order.
Key Takeaways:
- The current average effective tariff rate of 27% represents a historic shift in US trade policy
- Economic projections indicate significant GDP reduction, inflation increases, and employment losses
- Industry impacts vary substantially, with most sectors facing challenges from higher input costs and reduced export opportunities
- Historical precedent suggests broad, high tariffs typically produce negative economic outcomes
- Retaliatory measures from trading partners amplify the economic impact through reduced export opportunities
Looking forward, several scenarios could shape the evolution of US tariff policy:
Scenario 1: Negotiated Reductions
Tariffs serve as leverage for bilateral negotiations, leading to gradual reductions in exchange for trade concessions from partners. The 90-day EU delay suggests this path may be occurring with some trading partners.
Scenario 2: Sustained High Tariffs
Tariffs remain at current high levels for an extended period, forcing major supply chain restructuring and domestic price adjustments. This would likely accelerate reshoring of some manufacturing but at significant consumer cost.
Scenario 3: Escalation
Further tariff increases and expanding retaliatory measures lead to a full-scale trade war. This scenario presents the highest risk of global economic contraction and financial market disruption.
Businesses and investors facing this uncertain environment should consider several strategies:
- Supply Chain Diversification: Reduce concentration risk by developing alternate sourcing options
- Tariff Engineering: Explore product classification strategies to minimize tariff exposure
- Pricing Strategy Adjustment: Develop frameworks for when and how to pass through increased costs
- Political Risk Assessment: Monitor policy developments and maintain flexibility to adapt
- Investment in Automation: Reduce labor cost sensitivity through increased productivity
The coming months will be critical in determining whether current tariff policies represent a temporary negotiating position or a fundamental restructuring of the global trading system. Either way, the economic landscape has shifted dramatically, creating both challenges and opportunities for businesses operating in this new environment.
As history has repeatedly demonstrated, trade policy decisions have far-reaching consequences that often extend well beyond their immediate economic impacts. The current US tariff policies may prove to be a temporary deviation from the trend toward trade liberalization or could signal a more profound and lasting realignment of the global economic order.
References and Further Reading
- Yale University Budget Lab. (2025). The Fiscal, Economic, and Distributional Effects of All U.S. Tariffs Enacted in 2025 through April
- International Monetary Fund. (2025). Navigating Trade-Offs between Price and Financial Stability in Times of High Inflation
- J.P. Morgan Research. (2025). US Tariffs: What's the Impact?
- Center for Automotive Research. (2025). CAR Releases Tariff Impact Analysis
- Irwin, D. A. (2017). Clashing over Commerce: A History of US Trade Policy. University of Chicago Press.
- Council on Foreign Relations. (2025). What Are Tariffs?
- White House. (2025). Fact Sheet: President Donald J. Trump Declares National Emergency to Increase Our Competitive Edge, Protect Our Sovereignty, and Strengthen Our National and Economic Security
- Peterson Institute for International Economics. (2025). Trump's tariffs are designed for maximum damage
- American Apparel & Footwear Association. (2025). The Impact of Tariffs on the Apparel and Footwear Industry
- Tax Foundation. (2025). Trump Tariffs: The Economic Impact of the Trump Trade War

Roger Wood
With a Baccalaureate of Science and advanced studies in business, Roger has successfully managed businesses across five continents. His extensive global experience and strategic insights contribute significantly to the success of TimeTrex. His expertise and dedication ensure we deliver top-notch solutions to our clients around the world.
