What is the Average Salary in the US in 2024?


Table of Contents
What is the Average Salary in the US?
- Definition and Current Data
- Factors Influencing Salaries
- HR Specialists Annual Mean Wage by State
- Key Takeaways
Average Salary vs. Median Salary
- Definitions
- Importance of Both Metrics
Breakdown of Average Salaries by State
- Highest and Lowest States
- HR Managers Annual Mean Wage by State
- Regional Analysis
- State-by-State Data
Factors Contributing to State Variations
- Cost of Living
- Local Industries
- Economic Conditions
- Top-Paying Occupations
- State-Specific Occupations
- Occupational Trends
- Regions with the Highest Salaries
- Regions with the Lowest Salaries
- Impact of Regional Economies
Should You Move for a Higher Salary?
- Cost of Living Considerations
- US Median House Prices 1963 – 2024
- Quality of Life
- Job Market Conditions
- Historical Trends
- Future Projections
- Impact of Technology and Automation
‘Pro-Tip’
Leverage Automated Scheduling for Efficiency: Use TimeTrex’s automated scheduling feature to streamline shift planning and reduce administrative workload. Customize schedules to align with your business needs and employee availability, ensuring optimal coverage and compliance with labor laws.
What is the Average Salary in the US?
The average salary in the United States represents the sum of all individual incomes divided by the number of earners. This figure provides a broad overview of the earnings landscape across various professions, industries, and regions within the country. According to the latest data from the Social Security Administration (SSA), the national average salary is $63,795 per year. This statistic serves as a useful benchmark for comparing individual earnings and understanding overall economic conditions.
The average salary is an important indicator for policymakers, economists, and job seekers as it reflects the general economic health and living standards. It’s also a crucial metric for businesses to set competitive salaries and for employees to gauge their earning potential relative to the market.
SSA Average Wage Index US 1951 - 2022
| Year | Average Wage Index | Annual Change |
|---|---|---|
| 1951 | 2,799.16 | — |
| 1952 | 2,973.32 | 6.22% |
| 1953 | 3,139.44 | 5.59% |
| 1954 | 3,155.64 | 0.52% |
| 1955 | 3,301.44 | 4.62% |
| 1956 | 3,532.36 | 6.99% |
| 1957 | 3,641.72 | 3.10% |
| 1958 | 3,673.80 | 0.88% |
| 1959 | 3,855.80 | 4.95% |
| 1960 | 4,007.12 | 3.92% |
| 1961 | 4,086.76 | 1.99% |
| 1962 | 4,291.40 | 5.01% |
| 1963 | 4,396.64 | 2.45% |
| 1964 | 4,576.32 | 4.09% |
| 1965 | 4,658.72 | 1.80% |
| 1966 | 4,938.36 | 6.00% |
| 1967 | 5,213.44 | 5.57% |
| 1968 | 5,571.76 | 6.87% |
| 1969 | 5,893.76 | 5.78% |
| 1970 | 6,186.24 | 4.96% |
| 1971 | 6,497.08 | 5.02% |
| 1972 | 7,133.80 | 9.80% |
| 1973 | 7,580.16 | 6.26% |
| 1974 | 8,030.76 | 5.94% |
| 1975 | 8,630.92 | 7.47% |
| 1976 | 9,226.48 | 6.90% |
| 1977 | 9,779.44 | 5.99% |
| 1978 | 10,556.03 | 7.94% |
| 1979 | 11,479.46 | 8.75% |
| 1980 | 12,513.46 | 9.01% |
| 1981 | 13,773.10 | 10.07% |
| 1982 | 14,531.34 | 5.51% |
| 1983 | 15,239.24 | 4.87% |
| 1984 | 16,135.07 | 5.88% |
| 1985 | 16,822.51 | 4.26% |
| 1986 | 17,321.82 | 2.97% |
| 1987 | 18,426.51 | 6.38% |
| 1988 | 19,334.04 | 4.93% |
| 1989 | 20,099.55 | 3.96% |
| 1990 | 21,027.98 | 4.62% |
| 1991 | 21,811.60 | 3.73% |
| 1992 | 22,935.42 | 5.15% |
| 1993 | 23,132.67 | 0.86% |
| 1994 | 23,753.53 | 2.68% |
| 1995 | 24,705.66 | 4.01% |
| 1996 | 25,913.90 | 4.89% |
| 1997 | 27,426.00 | 5.84% |
| 1998 | 28,861.44 | 5.23% |
| 1999 | 30,469.84 | 5.57% |
| 2000 | 32,154.82 | 5.53% |
| 2001 | 32,921.92 | 2.39% |
| 2002 | 33,252.09 | 1.00% |
| 2003 | 34,064.95 | 2.44% |
| 2004 | 35,648.55 | 4.65% |
| 2005 | 36,952.94 | 3.66% |
| 2006 | 38,651.41 | 4.60% |
| 2007 | 40,405.48 | 4.54% |
| 2008 | 41,334.97 | 2.30% |
| 2009 | 40,711.61 | -1.51% |
| 2010 | 41,673.83 | 2.36% |
| 2011 | 42,979.61 | 3.13% |
| 2012 | 44,321.67 | 3.12% |
| 2013 | 44,888.16 | 1.28% |
| 2014 | 46,481.52 | 3.55% |
| 2015 | 48,098.63 | 3.48% |
| 2016 | 48,642.15 | 1.13% |
| 2017 | 50,321.89 | 3.45% |
| 2018 | 52,145.80 | 3.62% |
| 2019 | 54,099.99 | 3.75% |
| 2020 | 55,628.60 | 2.83% |
| 2021 | 60,575.07 | 8.89% |
| 2022 | 63,795.13 | 5.32% |
Data Retrieved From: https://www.ssa.gov/
Factors Influencing Salaries
While the national average provides a general picture, several factors significantly influence individual salaries. Understanding these factors can help explain why salaries vary widely across different regions, industries, and professions.
Location
- Cost of Living: Salaries often correlate with the cost of living in a given area. For instance, urban areas with high living costs, such as New York City, San Francisco, and Boston, tend to offer higher salaries to offset the expensive housing, transportation, and other living expenses. Conversely, rural or less densely populated areas typically have lower living costs and correspondingly lower average salaries.
- State-Specific Economic Conditions: Economic health varies from state to state, influencing local job markets. States with robust economies and thriving industries generally offer higher salaries. For example, technology hubs like California and Washington boast higher average salaries due to the concentration of high-paying tech jobs.
Industry
- High-Paying Industries: Certain industries inherently offer higher salaries due to the nature of their work, demand for specialized skills, and profitability. Industries such as healthcare, technology, finance, and engineering are known for higher-than-average salaries. For instance, the average salary in the tech industry is significantly higher than in retail or hospitality.
- Industry Demand and Supply: The demand for specific skills and the supply of qualified professionals also impact salaries. Industries experiencing rapid growth or skill shortages tend to offer higher wages to attract and retain talent.
Education
- Educational Attainment: Higher levels of education typically lead to higher earning potential. Advanced degrees, such as master’s degrees, Ph.D.s, or professional degrees (e.g., MD, JD), often result in significantly higher salaries compared to those with only a high school diploma or bachelor’s degree. For instance, physicians and surgeons, who require extensive education and training, earn substantially more than jobs requiring less education.
- Field of Study: The field of study also plays a crucial role. Degrees in STEM (Science, Technology, Engineering, Mathematics) fields generally lead to higher-paying jobs compared to degrees in humanities or social sciences.
Experience
- Years of Experience: Work experience is a critical factor in determining salary levels. As employees gain experience and expertise in their field, their value to employers increases, often leading to higher wages. For example, an entry-level software developer may earn significantly less than a senior software engineer with a decade of experience.
- Career Progression: Career advancement opportunities, such as promotions and managerial roles, typically come with increased responsibilities and higher pay.
Demand
- Job Market Conditions: The overall job market condition, including unemployment rates and job availability, influences salaries. In a competitive job market with low unemployment, employers may offer higher salaries to attract top talent. Conversely, in a sluggish job market, salaries may stagnate or grow slowly.
- Emerging Technologies and Trends: Technological advancements and industry trends can create new job opportunities and shift salary dynamics. For example, the rise of artificial intelligence and data science has led to increased demand and higher salaries for professionals with expertise in these areas.
HR Specialists Annual Mean Wage by State
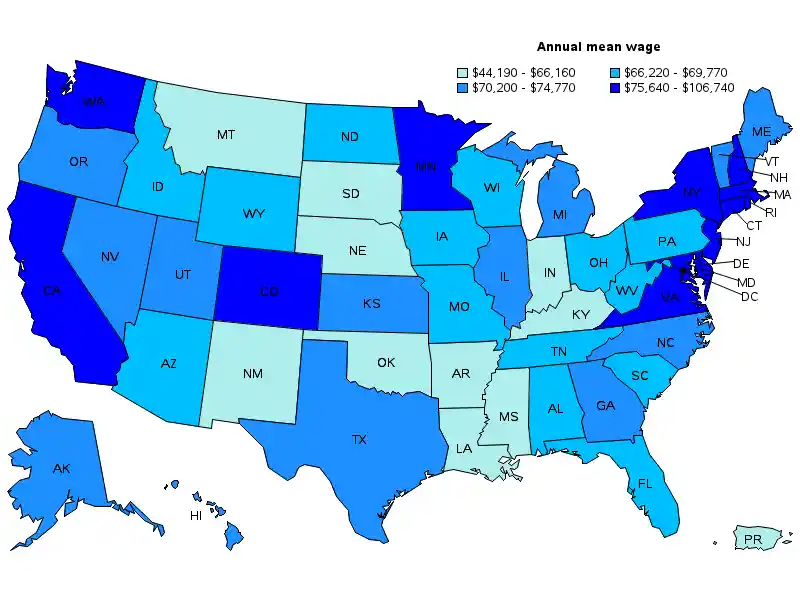
Image Retrieved From: https://www.bls.gov
‘Pro-Tip’
Optimize Attendance Tracking: Implement TimeTrex’s facial recognition technology to accurately track employee attendance and prevent time theft. This advanced feature ensures precise timekeeping, improving payroll accuracy and accountability.
Key Takeaways
- The national average salary in the US is $63,795 per year.
- Salaries are influenced by factors such as location, industry, education, experience, and demand.
- Higher costs of living and thriving local economies often lead to higher salaries.
- Advanced education and specialized fields generally result in higher earning potential.
- Experience and career progression significantly impact salary growth.
- Job market conditions and emerging industry trends also play a crucial role in determining salaries.
‘Pro-Tip’
Enhance Payroll Accuracy: Utilize TimeTrex’s payroll module to automate payroll calculations, tax deductions, and benefits administration. Regularly update employee information to ensure seamless payroll processing and compliance with tax regulations.
Average Salary vs. Median Salary
Average Salary
The average salary, also known as the mean salary, is calculated by adding up all individual salaries and dividing the total by the number of earners. This metric provides a general sense of the earnings landscape within a population.
Example Calculation:
If five employees have salaries of $30,000, $40,000, $50,000, $60,000, and $200,000, the average salary would be: Average Salary = (30,000+40,000+50,000+60,000+200,000)/5 = 380,000/5 = $76,000
Average Salary Calculator
Median Salary
The median salary represents the middle point in a dataset, where 50% of salaries are higher and 50% are lower. It is determined by arranging all salaries in ascending order and finding the middle value. If there is an even number of salaries, the median is the average of the two middle numbers.
Example Calculation: Using the same salaries as above: $30,000, $40,000, $50,000, $60,000, and $200,000, the median salary would be $50,000 (the third value in the ordered list).
If there were six salaries: $30,000, $40,000, $50,000, $60,000, $70,000, and $200,000, the median would be: Median Salary = (50,000+60,000)/2 = 55,000
Median Salary Calculator
Average Salary
Pros:
- General Overview: Provides a quick snapshot of overall earnings.
- Useful for Comparisons: Helpful for comparing earnings across different countries, regions, or industries.
Cons:
- Sensitive to Outliers: Can be heavily skewed by extremely high or low salaries, which may not accurately reflect the typical earnings of most workers.
Median Salary
Pros:
- Resistant to Outliers: Not affected by extreme values, making it a better indicator of typical earnings.
- Better Reflection of Typical Income: Provides a more accurate picture of what the middle earner makes, offering insight into the earnings of a typical worker.
Cons:
- Less Intuitive: May not provide the same immediate sense of overall earnings as the average salary.
Revealing Income Distribution
Both average and median salaries are crucial for understanding income distribution and economic health:
Income Distribution Insight:
- Average Salary: If the average salary is significantly higher than the median, it indicates a wide income distribution with a few high earners pulling the average up. This suggests income inequality, where a small percentage of the population earns much more than the rest.
- Median Salary: Offers a clearer picture of the typical income, helping to identify the midpoint of earnings. When the median is closer to the average, it suggests a more even income distribution.
Economic Analysis:
- Policy Making: Policymakers use both metrics to design and assess economic policies. The average salary can help in understanding overall economic growth, while the median salary can highlight issues related to income inequality and the effectiveness of social programs.
- Business Decisions: Employers use these metrics for setting competitive salaries, understanding market rates, and making informed hiring decisions.
Social Implications:
- Income Inequality: A large gap between the average and median salary can signal significant income inequality, prompting discussions on wage policies, taxation, and social welfare.
- Economic Mobility: Understanding both metrics can help analyze economic mobility and the ability of individuals to move up the economic ladder.
‘Pro-Tip’
Streamline Leave Management: Manage employee leave requests efficiently with TimeTrex’s leave management system. Track vacation, sick leave, and other absences, and ensure proper leave balance calculations to maintain workforce productivity.
Breakdown of Average Salaries by State
States with the Highest Average Salaries
- Massachusetts: With an average salary of $76,600, Massachusetts leads the nation. The high concentration of prestigious universities, leading healthcare institutions, and tech companies contribute to these higher earnings.
- New York: New York’s average salary stands at $74,870. The financial sector, legal services, and media industries play significant roles in boosting the state’s average salary.
- California: The average salary in California is $73,220. Silicon Valley and the entertainment industry are major contributors to the state’s high earnings.
States with the Lowest Average Salaries
- Mississippi: Mississippi has the lowest average salary at $45,180. The state’s economy is largely agricultural, with limited high-paying industries.
- Arkansas: The average salary in Arkansas is $48,570. The state has a significant proportion of jobs in agriculture, retail, and manufacturing, which typically offer lower wages.
- West Virginia: With an average salary of $49,170, West Virginia’s economy is heavily influenced by mining and energy production, sectors that often have lower average wages compared to high-tech or financial sectors.
Northeast
- Average Salary: $65,383
- Highest Average Salary: Massachusetts ($76,600)
- Economy: The Northeast is known for its financial services, healthcare, education, and technology sectors. High living costs in cities like New York and Boston also contribute to higher salaries.
West
- Average Salary: $60,579
- Highest Average Salary: California ($73,220)
- Economy: The West benefits from the tech boom in Silicon Valley, the entertainment industry in Los Angeles, and significant contributions from sectors like aerospace and tourism.
Midwest
- Average Salary: $56,114
- Highest Average Salary: Illinois ($63,930)
- Economy: The Midwest has a diverse economy including manufacturing, agriculture, and financial services. Cities like Chicago are major economic hubs that boost the region’s average salary.
South
- Average Salary: $54,718
- Highest Average Salary: Maryland ($69,750)
- Economy: The South has a mixed economy with significant contributions from agriculture, manufacturing, energy production, and increasingly, tech and finance in cities like Atlanta and Austin. Lower living costs in many Southern states typically correlate with lower average salaries.
HR Managers Annual Mean Wage by State
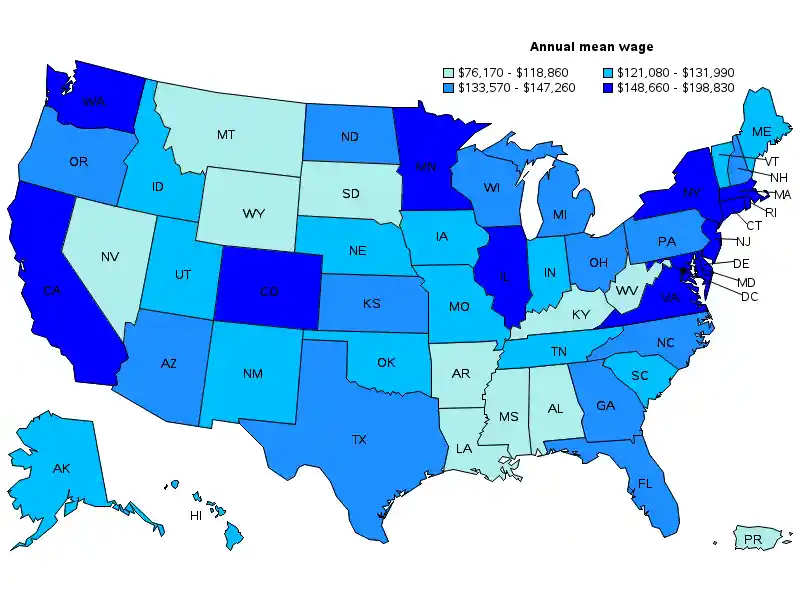
Image Retrieved From: https://www.bls.gov
State-by-State Data
| State | Average Salary | Median Salary |
|---|---|---|
| Alabama | $50,620 | $57,564 |
| Alaska | $66,130 | $66,820 |
| Arizona | $58,620 | $65,780 |
| Arkansas | $48,570 | $53,716 |
| California | $73,220 | $84,448 |
| Colorado | $67,870 | $74,152 |
| Connecticut | $69,310 | $78,572 |
| Delaware | $62,260 | $64,896 |
| Florida | $55,980 | $64,168 |
| Georgia | $58,000 | $64,844 |
| Hawaii | $61,420 | $62,296 |
| Idaho | $51,350 | $53,976 |
| Illinois | $63,930 | $70,564 |
| Indiana | $53,500 | $57,304 |
| Iowa | $53,520 | $56,264 |
| Kansas | $52,850 | $51,978 |
| Kentucky | $51,490 | $57,200 |
| Louisiana | $50,940 | $56,836 |
| Maine | $55,960 | $58,396 |
| Maryland | $69,750 | $72,904 |
| Massachusetts | $76,600 | $86,840 |
| Michigan | $58,000 | $63,440 |
| Minnesota | $63,640 | $63,380 |
| Mississippi | $45,180 | $48,048 |
| Missouri | $54,520 | $59,800 |
| Montana | $52,200 | $55,744 |
| Nebraska | $55,070 | $56,784 |
| Nevada | $55,490 | $61,828 |
| New Hampshire | $62,550 | $72,124 |
| New Jersey | $70,890 | $76,128 |
| New Mexico | $54,400 | $57,564 |
| New York | $74,870 | $84,292 |
| North Carolina | $56,220 | $62,296 |
| North Dakota | $55,800 | $61,568 |
| Ohio | $56,530 | $60,320 |
| Oklahoma | $50,940 | $54,704 |
| Oregon | $62,680 | $66,612 |
| Pennsylvania | $58,470 | $66,404 |
| Rhode Island | $64,530 | $63,492 |
| South Carolina | $50,650 | $56,108 |
| South Dakota | $49,890 | $53,820 |
| Tennessee | $52,820 | $62,140 |
| Texas | $57,300 | $68,744 |
| Utah | $57,360 | $61,516 |
| Vermont | $59,190 | $61,100 |
| Virginia | $65,590 | $71,292 |
| Washington | $72,350 | $85,748 |
| West Virginia | $49,170 | $55,900 |
| Wisconsin | $56,120 | $58,552 |
| Wyoming | $54,440 | $56,992 |
‘Pro-Tip’
Utilize Mobile Accessibility: Empower your employees with TimeTrex’s mobile app, allowing them to clock in/out, request leave, and view schedules from anywhere. This flexibility enhances convenience and improves overall employee satisfaction.
Factors Contributing to State Variations
How Cost of Living Impacts Salaries
- Regional Disparities: The cost of living varies significantly across different states and even within regions of the same state. High cost of living areas, such as metropolitan cities, typically offer higher salaries to offset the expensive housing, transportation, healthcare, and other living expenses. For example, cities like San Francisco, New York, and Boston have high average salaries that correspond with their high cost of living.
- Employer Adjustments: Employers in high-cost areas often need to provide competitive salaries to attract and retain talent. This includes not only higher base salaries but also additional benefits such as housing allowances, transportation subsidies, and other perks.
- Purchasing Power: A higher salary in a high-cost area might not necessarily translate to greater purchasing power compared to a lower salary in a region with a lower cost of living. For instance, a $70,000 salary in a rural area could provide a higher standard of living than a $100,000 salary in a major city with high expenses.
- Index and Adjustments: Many companies use cost-of-living indices to adjust salaries for employees relocating to different areas. These adjustments ensure that employees maintain their standard of living despite moving to a region with a different cost structure.
Influence of Dominant Industries in Different States
- Industry Concentration: States with a high concentration of certain industries tend to have higher average salaries in those sectors. For example, the technology industry in California, finance in New York, and energy in Texas are dominant sectors that significantly influence state average salaries.
- High-Paying Sectors: States with thriving high-paying sectors, such as technology, finance, healthcare, and engineering, generally offer higher average salaries. The presence of major corporations, tech hubs, and financial centers can drive up the average salary in these states.
- Job Opportunities and Skills: The availability of jobs in dominant industries and the specific skills required for those jobs also impact salaries. Regions known for specialized industries often have higher demand for skilled workers, leading to increased wages to attract the necessary talent.
- Economic Clusters: States with well-established economic clusters benefit from the synergy between businesses, academic institutions, and research centers. These clusters can lead to innovation, higher productivity, and subsequently higher salaries. For example, the Research Triangle in North Carolina is a hub for tech and biotech industries, offering competitive salaries.
State-Specific Economic Factors Affecting Salaries
- Economic Growth: States experiencing robust economic growth typically see an increase in average salaries. Economic expansion leads to job creation, higher demand for labor, and consequently higher wages. States with strong economic growth often attract more businesses and investments, further boosting employment opportunities and salaries.
- Unemployment Rates: Lower unemployment rates in a state generally lead to higher salaries as employers compete for a smaller pool of available workers. Conversely, states with high unemployment rates may see stagnation or slower growth in average salaries due to an oversupply of labor.
- Government Policies: State-specific policies, such as minimum wage laws, tax incentives for businesses, and investment in education and infrastructure, can significantly impact salaries. States with higher minimum wages and favorable business environments tend to offer better compensation packages.
- Economic Diversification: States with diversified economies are less susceptible to economic downturns in specific sectors. Diversification helps maintain stable employment and salary levels. For example, states like Texas and California have diverse economies with significant contributions from various sectors, which helps sustain higher average salaries.
- Inflation Rates: State-specific inflation rates affect the real value of salaries. High inflation can erode purchasing power, leading to demands for higher wages to maintain living standards. States with stable or low inflation rates are better able to maintain consistent salary levels.
‘Pro-Tip’
Ensure Compliance with Labor Laws: Keep up-to-date with labor law changes and configure TimeTrex to automatically enforce compliance. This includes overtime rules, break requirements, and other regulations specific to your region.
Average Salary by Occupation
List of Highest-Paying Jobs and Their Average Salaries
- Physicians and Surgeons: Average salary around $208,000. These medical professionals, especially those in specialized fields such as cardiology and orthopedic surgery, command the highest salaries due to their extensive education, training, and the critical nature of their work.
- Dentists: Average salary around $175,000. Dentists, particularly those specializing in orthodontics and oral surgery, earn high wages due to the specialized skills required and the demand for dental health services.
- Pharmacists: Average salary around $128,000. Pharmacists play a vital role in healthcare by dispensing medications and advising on their safe use, contributing to their high salaries.
- Petroleum Engineers: Average salary around $137,000. The energy sector offers lucrative salaries for petroleum engineers who design and develop methods for extracting oil and gas.
- IT Managers: Average salary around $151,000. Information technology managers oversee the IT departments of organizations, managing technological resources and ensuring systems run smoothly.
- Financial Managers: Average salary around $134,000. These professionals manage the financial health of organizations, making critical decisions about investments, budgets, and financial planning.
- Lawyers: Average salary around $122,000. Lawyers, especially those in corporate law, intellectual property, and high-stakes litigation, earn substantial salaries due to the specialized knowledge and high demand for their services.
- Airline Pilots and Flight Engineers: Average salary around $160,000. These professionals ensure the safe transportation of passengers and cargo, necessitating high levels of expertise and responsibility.
- Architectural and Engineering Managers: Average salary around $144,000. These managers coordinate activities in architectural and engineering companies, overseeing the development and implementation of technical projects.
- Marketing Managers: Average salary around $147,000. Marketing managers plan, direct, and coordinate marketing policies and programs, driving sales and brand awareness.
Surgeons Annual Mean Wage by State
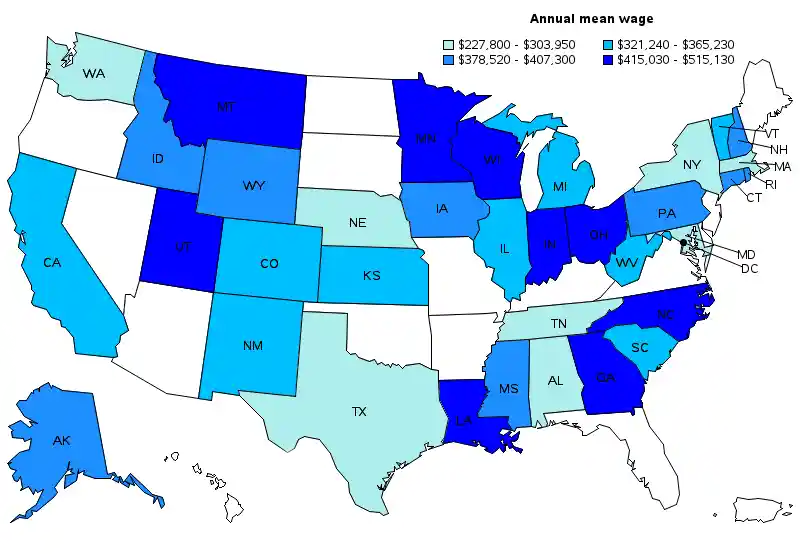
Image Retrieved From: https://www.bls.gov
High-Paying Occupations Unique to Certain States
- Technology Sector in California: Software developers, data scientists, and cybersecurity experts in California earn significantly higher salaries compared to other states, with averages often exceeding $120,000. Silicon Valley is a hub for tech innovation, attracting top talent and offering competitive salaries.
- Finance in New York: Investment bankers, financial analysts, and hedge fund managers in New York City command high salaries, often surpassing $150,000 due to the city’s status as a global financial center.
- Energy Sector in Texas: Petroleum engineers, geoscientists, and energy traders in Texas benefit from the state’s robust oil and gas industry, with average salaries for these roles often exceeding $130,000.
- Healthcare in Massachusetts: Biomedical engineers, medical scientists, and healthcare administrators in Massachusetts, particularly in the Boston area, earn high salaries due to the concentration of leading hospitals and research institutions. Salaries in these fields can average over $110,000.
- Entertainment Industry in California: Film and television producers, directors, and actors in Los Angeles often earn substantial incomes, with top professionals in the industry earning millions annually.
Emerging Trends and Their Impact on Salaries
- Technology and Automation: The rapid advancement of technology and automation is driving demand for professionals skilled in artificial intelligence, machine learning, and robotics. These emerging fields offer high salaries, often exceeding $120,000, as companies compete for top talent to drive innovation.
- Remote Work: The shift towards remote work, accelerated by the COVID-19 pandemic, has transformed job markets. Roles that support remote infrastructure, such as IT support specialists and cloud computing experts, are seeing increased demand and higher salaries.
- Healthcare Expansion: The ongoing need for healthcare services, especially in response to an aging population and global health challenges, continues to drive up salaries for healthcare professionals. New specializations, such as telehealth and healthcare data analytics, are emerging, offering competitive salaries.
- Sustainability and Green Jobs: The growing focus on sustainability and renewable energy is creating new high-paying job opportunities. Environmental engineers, renewable energy project managers, and sustainability consultants are in demand, with salaries often exceeding $90,000.
- Cybersecurity: With increasing cyber threats, the demand for cybersecurity professionals is surging. Cybersecurity analysts, penetration testers, and information security managers are among the top-paying roles, with average salaries ranging from $100,000 to $140,000.
- Biotechnology: Advances in biotechnology are creating lucrative opportunities for biochemists, geneticists, and biostatisticians. These roles are crucial in developing medical innovations, with salaries often exceeding $100,000.
‘Pro-Tip’
Monitor Overtime Costs: Use TimeTrex to track and analyze overtime hours and costs. Identify patterns and implement strategies to reduce unnecessary overtime, such as optimizing schedules or hiring additional staff during peak times.
Regional Salary Trends
Analysis of High-Salary Regions
Northeast
- States with High Salaries: Massachusetts, New York, Connecticut, New Jersey.
- Key Industries: Finance, technology, healthcare, education.
- Factors Contributing to High Salaries:
- Financial Hubs: New York City is a global financial center, home to many of the world’s largest banks, investment firms, and financial institutions. This concentration drives up salaries in the finance sector.
- Educational Institutions: Prestigious universities and colleges in states like Massachusetts (Harvard, MIT) and Connecticut (Yale) attract top talent and high-paying research and academic jobs.
- Healthcare Sector: The Northeast is known for its world-class healthcare facilities and medical research institutions, offering high salaries to medical professionals and researchers.
- Tech and Innovation: Boston, Massachusetts, has a thriving tech scene, particularly in biotechnology and pharmaceuticals, contributing to high regional salaries.
West
- States with High Salaries: California, Washington.
- Key Industries: Technology, entertainment, aerospace, healthcare.
- Factors Contributing to High Salaries:
- Silicon Valley: The tech industry in Silicon Valley, California, is renowned globally, with companies like Google, Apple, and Facebook offering lucrative salaries to attract top talent.
- Entertainment Industry: Los Angeles is the epicenter of the entertainment industry, with high-paying jobs for producers, directors, and actors.
- Aerospace: Seattle, Washington, is home to major aerospace companies like Boeing, driving high salaries in the engineering and manufacturing sectors.
- Healthcare: California has numerous leading healthcare institutions and biotech companies, contributing to higher salaries in these fields.
Mid-Atlantic
- States with High Salaries: Maryland, Virginia.
- Key Industries: Government, defense, technology, healthcare.
- Factors Contributing to High Salaries:
- Government and Defense: Proximity to Washington, D.C., results in high-paying federal government and defense contractor jobs.
- Technology and Cybersecurity: Maryland, particularly around the Baltimore-Washington area, is a hub for cybersecurity and tech jobs, offering competitive salaries.
- Healthcare and Education: Prestigious universities and medical institutions in this region contribute to high salaries in education and healthcare.
Analysis of Low-Salary Regions
South
- States with Low Salaries: Mississippi, Arkansas, West Virginia, Alabama.
- Key Industries: Agriculture, manufacturing, retail, mining.
- Factors Contributing to Low Salaries:
- Agriculture and Manufacturing: These states have economies that are heavily reliant on agriculture and manufacturing, which typically offer lower wages compared to high-tech or finance sectors.
- Cost of Living: The cost of living in these states is generally lower, which corresponds with lower average salaries. Employers offer salaries that align with the local cost of living, which is lower than in high-salary regions.
- Limited High-Paying Industries: These states lack the concentration of high-paying industries such as technology, finance, and advanced healthcare found in other regions.
Midwest
- States with Low Salaries: South Dakota, Iowa, Nebraska.
- Key Industries: Agriculture, manufacturing, retail.
- Factors Contributing to Low Salaries:
- Agricultural Economy: The Midwest is a significant agricultural hub, with many jobs centered around farming and food production, which tend to offer lower wages.
- Manufacturing Jobs: While important, manufacturing jobs in the Midwest do not pay as much as tech or finance jobs found in other regions.
- Lower Living Costs: Similar to the South, the Midwest has a lower cost of living, which influences the average salary levels.
Mountain West
- States with Low Salaries: Montana, Idaho, Wyoming.
- Key Industries: Agriculture, tourism, mining.
- Factors Contributing to Low Salaries:
- Tourism and Agriculture: The economy in many of these states relies on tourism (e.g., national parks) and agriculture, both of which generally offer lower wages.
- Mining: While mining jobs can be well-paid, they are not as prevalent, leading to overall lower average salaries in these states.
How Regional Economic Health Influences Salaries
Economic Growth:
- Positive Growth: Regions experiencing robust economic growth often see higher salaries as businesses expand and demand for labor increases. This growth can attract new industries, further driving up wages.
- Stagnation or Decline: Regions with stagnant or declining economies may experience slower salary growth or wage stagnation. Economic challenges can lead to higher unemployment rates, putting downward pressure on wages.
Industry Concentration:
- Diverse Economies: Regions with a diverse mix of high-paying industries tend to have higher average salaries. Economic diversification helps insulate regions from sector-specific downturns and supports stable wage growth.
- Single-Industry Dominance: Areas reliant on a single industry, especially if that industry offers lower wages (e.g., agriculture, retail), tend to have lower average salaries. Economic health in these regions can be more volatile, heavily influenced by the performance of that dominant industry.
Investment in Education and Infrastructure:
- Education: Regions investing heavily in education tend to have higher salaries due to a more skilled workforce. This attracts businesses that require higher levels of education and training, offering competitive wages to secure top talent.
- Infrastructure: Good infrastructure supports economic activity by improving efficiency and connectivity. Regions with well-developed infrastructure can attract diverse industries and foster economic growth, leading to higher salaries.
Government Policies:
- Pro-Business Policies: States with policies that encourage business investment and growth, such as tax incentives and favorable regulatory environments, often see higher salaries. These policies can attract companies looking to expand or relocate, boosting the job market and wages.
- Labor Protections: Strong labor protections, including minimum wage laws and worker rights, can positively impact salaries. States with higher minimum wages tend to have higher average salaries, lifting the earnings floor for many workers.
Regional Disparities:
- Urban vs. Rural: Urban areas typically offer higher salaries than rural areas due to the concentration of high-paying industries and the higher cost of living in cities. Rural areas may struggle with economic development, resulting in lower average wages.
- Access to Capital: Regions with better access to capital for businesses, such as through venture capital, government grants, and loans, can spur innovation and entrepreneurship. This economic activity can lead to job creation and higher salaries.
‘Pro-Tip’
Implement Employee Self-Service: Encourage employees to use TimeTrex’s self-service portal for tasks such as updating personal information, viewing pay stubs, and managing schedules. This empowers employees and reduces administrative workload.
Should You Move for a Higher Salary?
Evaluating the Cost of Living When Considering Relocation
- Housing Costs: One of the most significant factors in the cost of living is housing. Before relocating for a higher salary, research the housing market in the potential new location. Compare rental prices and home purchase costs to those in your current location. In high-salary areas like San Francisco or New York City, housing costs can consume a significant portion of income, potentially offsetting the benefits of a higher salary.
- Transportation: Consider transportation costs, including commuting expenses, public transit availability, and car ownership costs. In some cities, you might spend more on transportation due to longer commutes or higher fuel prices, impacting your overall financial situation.
- Utilities and Services: Evaluate the cost of utilities (electricity, water, internet) and other essential services. Some regions have higher utility costs due to climate, regulatory factors, or infrastructure differences.
- Groceries and Dining: Food costs can vary widely between regions. Look into the average prices of groceries and dining out in the new location to understand how these expenses might affect your budget.
- Healthcare: Healthcare costs, including insurance premiums, copays, and out-of-pocket expenses, can differ significantly between states. Research the healthcare system and average costs in the area you’re considering.
- Taxes: State and local taxes can have a considerable impact on your take-home pay. Some states have no income tax, while others have high state income taxes. Property taxes and sales taxes also vary, so factor these into your financial calculations.
US Median House Prices 1963 - 2024
Data Retrieved From: https://fred.stlouisfed.org/
Balancing Salary with Lifestyle Factors
- Work-Life Balance: A higher salary often comes with increased job responsibilities and longer working hours. Consider whether the potential increase in salary is worth the potential decrease in work-life balance.
- Community and Social Life: Think about the social and community aspects of the new location. Proximity to family and friends, the availability of social and recreational activities, and the overall community vibe can significantly affect your happiness and well-being.
- Climate and Environment: The climate and natural environment of a location can influence your quality of life. Some people thrive in urban environments, while others prefer rural or suburban settings. Consider how the climate, outdoor activities, and natural beauty align with your lifestyle preferences.
- Education and Schools: If you have children or plan to have them, research the quality of schools and educational opportunities in the new area. Good schools can enhance your children’s future prospects but may come at a higher cost in terms of housing and taxes.
- Healthcare and Safety: Access to quality healthcare facilities and living in a safe neighborhood are crucial components of a good quality of life. Investigate healthcare options, crime rates, and overall safety in the new location.
- Cultural Amenities: Consider the availability of cultural amenities such as museums, theaters, restaurants, and parks. These can enrich your life and provide valuable leisure and learning opportunities.
Assessing the Job Market in Potential New Locations
- Industry Presence: Determine whether the industry you work in has a strong presence in the new location. Regions with a concentration of employers in your field can provide better job security and opportunities for advancement.
- Employment Rates: Research the employment rates and job market conditions in the new area. Lower unemployment rates can indicate a healthier job market and potentially more job opportunities.
- Professional Growth: Consider the potential for professional growth and development in the new location. Are there opportunities for training, networking, and career advancement? Look into local professional organizations, industry events, and educational institutions that can support your career.
- Economic Stability: Assess the overall economic stability of the region. Areas with diverse economies and strong economic growth are likely to offer more job stability and growth prospects.
- Company Benefits and Culture: Beyond salary, investigate the benefits and workplace culture of potential employers in the new location. Benefits such as health insurance, retirement plans, and paid time off can significantly impact your overall compensation and job satisfaction.
- Remote Work Opportunities: With the rise of remote work, you might not need to relocate to benefit from higher salaries. Explore companies offering remote positions that allow you to maintain your current living situation while accessing higher-paying job opportunities.
‘Pro-Tip’
Regularly Review and Update Policies: Periodically review your company policies and ensure they are reflected accurately in TimeTrex. This includes attendance policies, leave accruals, and payroll rules to maintain consistency and compliance.
Salary Trends and Projections
Overview of Salary Trends Over the Past Decade
Steady Growth:
- Over the past decade, the average salary in the United States has shown a steady increase. From 2010 to 2020, salaries grew at an average annual rate of about 2-3%. This growth, although modest, reflects general economic recovery following the Great Recession of 2008-2009.
- Factors contributing to this steady growth include gradual improvements in the economy, increased productivity, and a competitive job market.
Inflation-Adjusted Salaries:
- When adjusted for inflation, real wage growth has been slower. Inflation has eroded some of the gains in nominal wages, making the increase in purchasing power less significant than the raw numbers suggest.
- In the last decade, average annual real wage growth has hovered around 1-1.5%, highlighting the challenge of maintaining living standards despite rising nominal salaries.
Sector-Specific Trends:
- Technology: The tech sector has seen some of the most substantial salary increases, driven by high demand for skilled workers and rapid innovation. Roles in software development, cybersecurity, and data science have experienced significant wage growth.
- Healthcare: Salaries in healthcare have also risen, particularly for specialized roles such as nurse practitioners, physician assistants, and medical researchers, due to an aging population and increasing demand for healthcare services.
- Finance and Legal: Finance and legal sectors have seen steady increases, with high demand for expertise in areas like financial analysis, corporate law, and compliance.
Geographical Variations:
- Salary growth has not been uniform across the country. Coastal cities like San Francisco, New York, and Boston have seen higher-than-average salary increases, driven by booming local economies and high living costs.
- In contrast, some regions in the Midwest and South have experienced slower wage growth, reflecting more modest economic conditions and lower costs of living.
Expected Salary Trends and Economic Forecasts
Projected Salary Growth:
- Analysts predict that salaries will continue to grow over the next decade, with an estimated average annual growth rate of 2-3%. However, this will largely depend on overall economic conditions, inflation rates, and labor market dynamics.
- Sectors expected to lead this growth include technology, healthcare, and renewable energy, driven by continued innovation and demand for specialized skills.
Influence of Inflation:
- Inflation will remain a critical factor in real wage growth. If inflation rates rise significantly, nominal salary increases may not translate into increased purchasing power. Current forecasts suggest a moderate inflation rate of 2-3%, but this could change based on global economic conditions.
Sector-Specific Projections:
- Technology: Continued growth in artificial intelligence, machine learning, and cybersecurity is expected to drive substantial salary increases in these fields. The tech sector is likely to remain a key driver of high-paying jobs.
- Healthcare: The healthcare industry is projected to see continued salary growth due to an aging population and the ongoing need for medical services. Roles in telehealth and healthcare IT are expected to grow rapidly.
- Renewable Energy: As the world moves toward greener energy solutions, jobs in renewable energy (solar, wind, and battery technology) are expected to see significant salary growth.
Geographical Shifts:
- Remote work trends may lead to more balanced salary growth across regions. As companies become more flexible with remote work policies, employees in traditionally lower-wage areas may see improved salary prospects.
- Cities and states investing in technology and infrastructure are likely to attract higher-paying jobs and experience faster salary growth.
How Technological Advancements Might Affect Future Salaries
Automation and AI:
- Automation and artificial intelligence (AI) are set to transform many industries, potentially displacing certain jobs while creating new opportunities. Routine, manual tasks are most at risk, while jobs requiring complex problem-solving, creativity, and interpersonal skills are likely to remain secure.
- Workers in roles vulnerable to automation may face downward pressure on salaries unless they upskill or transition to more secure positions.
Demand for Tech Skills:
- The demand for technology-related skills will continue to rise. Jobs in AI, data science, software development, and cybersecurity will command higher salaries due to the specialized knowledge required and the critical role these positions play in modern businesses.
- Continuous learning and adaptation will be crucial for workers to stay relevant and competitive in the job market.
Gig Economy and Freelancing:
- Technology platforms are enabling the growth of the gig economy, where more workers are employed as freelancers or independent contractors. While this offers flexibility, it also leads to variability in income and benefits.
- Salaries in the gig economy can vary widely depending on the skillset, industry, and market demand. High-skilled freelancers in tech and creative fields can command high rates, while others may experience more income instability.
Globalization and Remote Work:
- Technology facilitates remote work and globalization, allowing companies to tap into talent pools worldwide. This can lead to competitive salaries for highly skilled workers regardless of their location.
- However, it also means that workers in high-cost regions might face competition from equally skilled individuals in lower-cost areas, potentially exerting downward pressure on local wages.
Upskilling and Lifelong Learning:
- To thrive in an increasingly automated world, workers will need to continuously update their skills. Employers may offer higher salaries to those with advanced technical skills, certifications, and a demonstrated ability to adapt to new technologies.
- Investment in education and training programs by both individuals and companies will be critical to keeping pace with technological advancements and maintaining competitive salaries.
‘Pro-Tip’
Use Real-Time Notifications: Enable real-time notifications in TimeTrex to alert employees and managers about schedule changes, upcoming shifts, and important announcements. This ensures timely communication and reduces misunderstandings.
FAQ Section
What is the difference between a gross salary and a net salary?
- Gross Salary: Gross salary is the total amount of money an employee earns before any deductions are made. This includes base pay, bonuses, overtime, and any other additional compensation.
- Net Salary: Net salary, also known as take-home pay, is the amount of money an employee actually receives after deductions. These deductions typically include taxes, social security contributions, health insurance premiums, retirement contributions, and any other withholdings.
How do salary increases typically work?
- Annual Raises: Many companies offer annual raises to employees based on performance, company profitability, and market conditions. These raises are usually a percentage of the current salary and aim to keep up with inflation and reward performance.
- Promotions: Promotions often come with significant salary increases as they involve taking on greater responsibilities and more senior roles.
- Cost-of-Living Adjustments (COLAs): Some organizations provide COLAs to adjust salaries based on changes in the cost of living, particularly in areas with high inflation rates.
What are the common components of a compensation package?
- Base Salary: The fixed amount of money an employee earns on a regular basis, typically expressed as an annual sum.
- Bonuses: Additional compensation given based on performance, company profits, or other criteria.
- Benefits: Non-monetary compensation such as health insurance, retirement plans, paid time off, and wellness programs.
- Equity Compensation: Stock options or shares in the company, which can be a significant part of compensation, especially in startups and tech companies.
- Allowances: Extra payments to cover specific expenses, such as travel, housing, or education.
How do overtime pay and holiday pay work?
- Overtime Pay: Employees who work more than their standard hours (typically 40 hours per week) are often eligible for overtime pay, which is usually calculated at 1.5 times the regular hourly rate. Some roles, particularly those classified as exempt under labor laws, may not qualify for overtime pay.
- Holiday Pay: Many employers offer additional pay or time off for working on holidays. This can be a premium rate (e.g., double time) or compensatory time off.
How can employees negotiate a higher salary?
- Research Market Rates: Understand the average salary for your role in your industry and location by using resources like salary surveys and job postings.
- Highlight Achievements: Demonstrate your value by highlighting your achievements, skills, and contributions to the company.
- Prepare a Strong Case: Gather evidence such as performance reviews, metrics of success, and testimonials to support your request.
- Timing: Choose the right time to negotiate, such as during performance reviews, after a significant achievement, or when taking on additional responsibilities.
- Be Professional: Approach the negotiation professionally and be prepared to discuss and justify your request.
What are the trends in salary transparency?
- Increased Transparency: There is a growing trend toward salary transparency, with many companies now disclosing salary ranges in job postings to promote fairness and attract talent.
- Legal Requirements: Some regions have enacted laws requiring salary transparency to address pay equity issues. For example, Colorado and New York City have laws mandating salary range disclosures in job ads.
- Employee Expectations: More employees expect transparency about salary ranges and pay scales, viewing it as a factor in trust and job satisfaction.
How do educational qualifications affect salary?
- Higher Education: Generally, higher educational qualifications lead to higher salaries. Advanced degrees such as a master’s, Ph.D., or professional degrees (e.g., JD, MD) can significantly boost earning potential.
- Field of Study: The impact of educational qualifications on salary also depends on the field of study. Degrees in STEM fields, business, and healthcare tend to offer higher starting salaries compared to degrees in the arts and humanities.
- Certifications and Skills: Specialized certifications and skills can also enhance salary prospects, particularly in industries like IT, finance, and engineering.
How does experience impact salary growth?
- Years of Experience: Generally, as employees gain more experience, their salaries increase. This is due to accumulated skills, knowledge, and the ability to take on more complex tasks and responsibilities.
- Career Advancement: Experience can lead to promotions and advanced roles, which come with higher salaries. Professional growth and continuous learning are key to salary progression.
- Industry and Role: The impact of experience on salary can vary by industry and role. Some industries value experience highly and offer significant salary increases over time, while others may have flatter salary growth trajectories.
How can geographic location influence salary?
- Cost of Living: Higher salaries in urban areas often reflect the higher cost of living. For example, tech jobs in San Francisco offer higher salaries compared to similar roles in smaller cities.
- Industry Presence: Regions with a high concentration of specific industries tend to offer higher salaries in those fields. For instance, finance jobs in New York City and oil and gas jobs in Houston command premium wages.
- Economic Conditions: Economic health and local demand for specific skills can also influence salaries. Regions with thriving economies and low unemployment rates tend to offer higher wages.
What is the role of salary surveys and benchmarks?
- Salary Surveys: Organizations and individuals use salary surveys to understand current compensation trends in various industries and regions. These surveys collect data from multiple sources to provide insights into average salaries, benefits, and compensation practices.
- Benchmarks: Companies use salary benchmarks to set competitive compensation levels. By comparing their salaries with industry standards, companies ensure they attract and retain talent while maintaining internal pay equity.
Disclaimer: The content provided on this webpage is for informational purposes only and is not intended to be a substitute for professional advice. While we strive to ensure the accuracy and timeliness of the information presented here, the details may change over time or vary in different jurisdictions. Therefore, we do not guarantee the completeness, reliability, or absolute accuracy of this information. The information on this page should not be used as a basis for making legal, financial, or any other key decisions. We strongly advise consulting with a qualified professional or expert in the relevant field for specific advice, guidance, or services. By using this webpage, you acknowledge that the information is offered “as is” and that we are not liable for any errors, omissions, or inaccuracies in the content, nor for any actions taken based on the information provided. We shall not be held liable for any direct, indirect, incidental, consequential, or punitive damages arising out of your access to, use of, or reliance on any content on this page.
About The Author

Roger Wood
With a Baccalaureate of Science and advanced studies in business, Roger has successfully managed businesses across five continents. His extensive global experience and strategic insights contribute significantly to the success of TimeTrex. His expertise and dedication ensure we deliver top-notch solutions to our clients around the world.
Time To Clock-In
Start your 30-day free trial!
Experience the Ultimate Workforce Solution and Revolutionize Your Business Today
- Eliminate Errors
- Simple & Easy To Use
- Real-time Reporting

Saving businesses time and money through better workforce management since 2003.
Copyright © 2026 TimeTrex. All Rights Reserved.